Classical Scale Development - Dissertaion Overview
This write up is intended for anyone interested in learning about scale development or the broad strokes of my dissertation. It’s meant to illustrate my most involved research project to date for non-academic audiences. The full paper can be found on the University of Texas at Austin’s Graduate School dissertation repository.
Measuring without Mass
One of the areas of social science research I enjoy more than others is how we measure concepts, ideas, attitudes, and beliefs. I gravitated toward it because it involves taking everything you know about a concept and pointing to as manyobservable parts of it as possible. The more parts you have, the easier it is to make out the whole. In latent variable measurement, the goal is consistently pointing to the underlying concept. It’s a great puzzle-solving exercise because once you’ve determined that the concept exists - you can break it apart into manageable chunks and piece the whole thing together.
The chunks are important because, although you can use a single measurement, the quality and reliability are more challenging to maintain. You see this in Economics measurements like “business confidence” and “quality of life” to infer market performance. Psychology measures latent variables for personality traits consistent across populations. No matter the discipline, latent variables must be measured indirectly because they’re unobservable. This is where the conceptual starts to take shape. Once we can consistently measure an idea, it becomes easier to know what parts of that idea influence change.
Science Communication Engagement Response
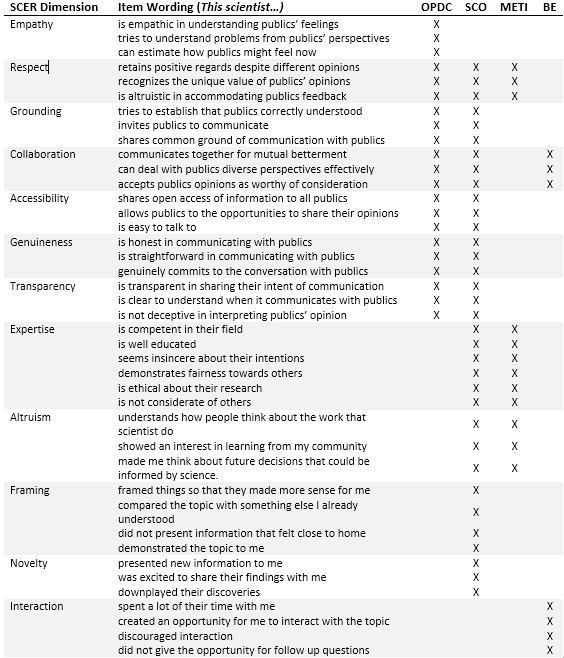
Science communication has deep roots in journalism, but a changing media landscape has eclipsed the traditional mode of disseminating science news and information. I could spend a whole day on the evolution from science journalists to science communication TikTok accounts. For now, know that this scale focuses on audience engagement from a science communication message (the format, content, and complexity of information are stripped away for this current version). Anytime a scientist, science journalist, or science communication influencer wants to tell you about something, there are a handful of objectives they’re aiming for. Those objectives have been outlined and redefined throughout the academic literature, but they generally include the following:
- demonstrating expertise
- communicating societal altruism
- demonstrating transparency
- showing attentiveness
- framing complex information in easily digestible ways
- showcasing a novel idea or innovation
The overall goal from these objectives is to see scientists and the pursuit of science as informative, interesting, accurate, and relative. Hitting all these objectives isn’t always acheivable or necessary. You more often see different content focusing on a couple of these objectives at a time. An article from Popular Mechanics might demonstrate more framing and expertise, while an Instagram Reel may focuse on the novelty of a discovery or a personal anecdote from a popular physicist. Both are considered science communication, and both are tuned to the specific format and audience.
Because social media has the hold on modern communication channels that it does, and more research grants look for public engagement strategies, it’s up to scientists and researchers to craft these messages for public consumption. The lingering question I focused on is: How do we determine their effectiveness as science communication messages?
Other Parts of the Whole
During my PhD, I combed the literature on science communication and all the associated concepts with “high-quality engagement.” The layers of that phrase peel back like a never-ending onion. I focused on a scale that would measure digital engagement so content creators could accurately guage their efforts. The first area I incorporated stemmed from a study on the effects of interactivity on health campaigns I did in grad schoool. This helped me identify structures of interactivity that we label as “engagement” like mechanisms you use to give feedback on a post (likes, comments, shares, etc.).
Next, I included ideas and research about how science communication is two-way, even when it’s not. I took most of my ideas from Organizational Communication theories because science itself is an institution. It has a process, hierarchy, and governing bodies that maintain its integrity. Organizations like the American Association for the Advancement of Science (AAAS) and the National Science Foundation maintain these beliefs. From the outside looking in, it can feel like a fortress of knowledge. But, the doors of this fortress are wide open. I see it more like your public library - there’s a lot of cool stuff in there, and sometimes it takes help or consistent effort to understand/find it.
Finally, there’s a broad research area into how people think about and trust these institutions. Epistemic trust, willingness to accept new information from others instead of lived experiences or direct observation, would help the final measurement tool to control for the audience’s inherint trust/distrust. It’s similar to the concept of credibility but shifts the focus away from the individual. This concept stands on it’s own as a latent variable, and successful scales have been created to measure its effect (Muenster Epistemic Trustworthiness Iventory). I included conceptual linkages on epistemic trustworthiness in this scale to account for increased/decreased engagment.
These four areas—science Communication Objectives, Interactivity, Organizational Communication, and Epistemic Trustworthiness—supplied enough prior theory, measurement scales, and existing research to lay the foundation of my initial questionnaire. An early draft of these connections and their conceptual mappings created my roadmap. Next, I needed to collect data and connect the dots.
Methodology
The classic social science scale development process includes a pre-data collection exercise where it’s suggested you interview other researchers in the field to get their thoughts on your idea. It’s unique to scale development because, at that point, you’re working with the craftsman of the trade to develop a tool they can and want to use. Over the course of a few weeks, I conducted in-depth interviews with other science communication researchers training instructors, and practitioners on the ideas I put together. They were all enthusiastic and echoed my claims. Qualitatively analyzing my conversations with a supplementary LDA topic model solidified these ideas.
I created a final questionnaire for data collection on all the ideas I had on measureing science communication engagement. I wrote new questions for each part of my variable and used what I could from existing scales when they made sense. Some of the questions in were reframed to protect against response bias of only positive responses (i.e. wording the question so that a negative rating indicated higher engagement). Those questions were then reverse coded during data analysis.
My 41-item questionnaire was distilled into a 12-item scale that reflected my research. The factor analysis provided a concise and reliable outcome - a tool for science communication professionals to evaluate their public engagement efforts. The theories I mapped made sense to those with expertise in the discipline, and the individual items emerged from the exploratory factor analysis of survey responses. The 12 individual questions reflected the idea that science communication engagement could be consistently measured within my sample (n = 400).
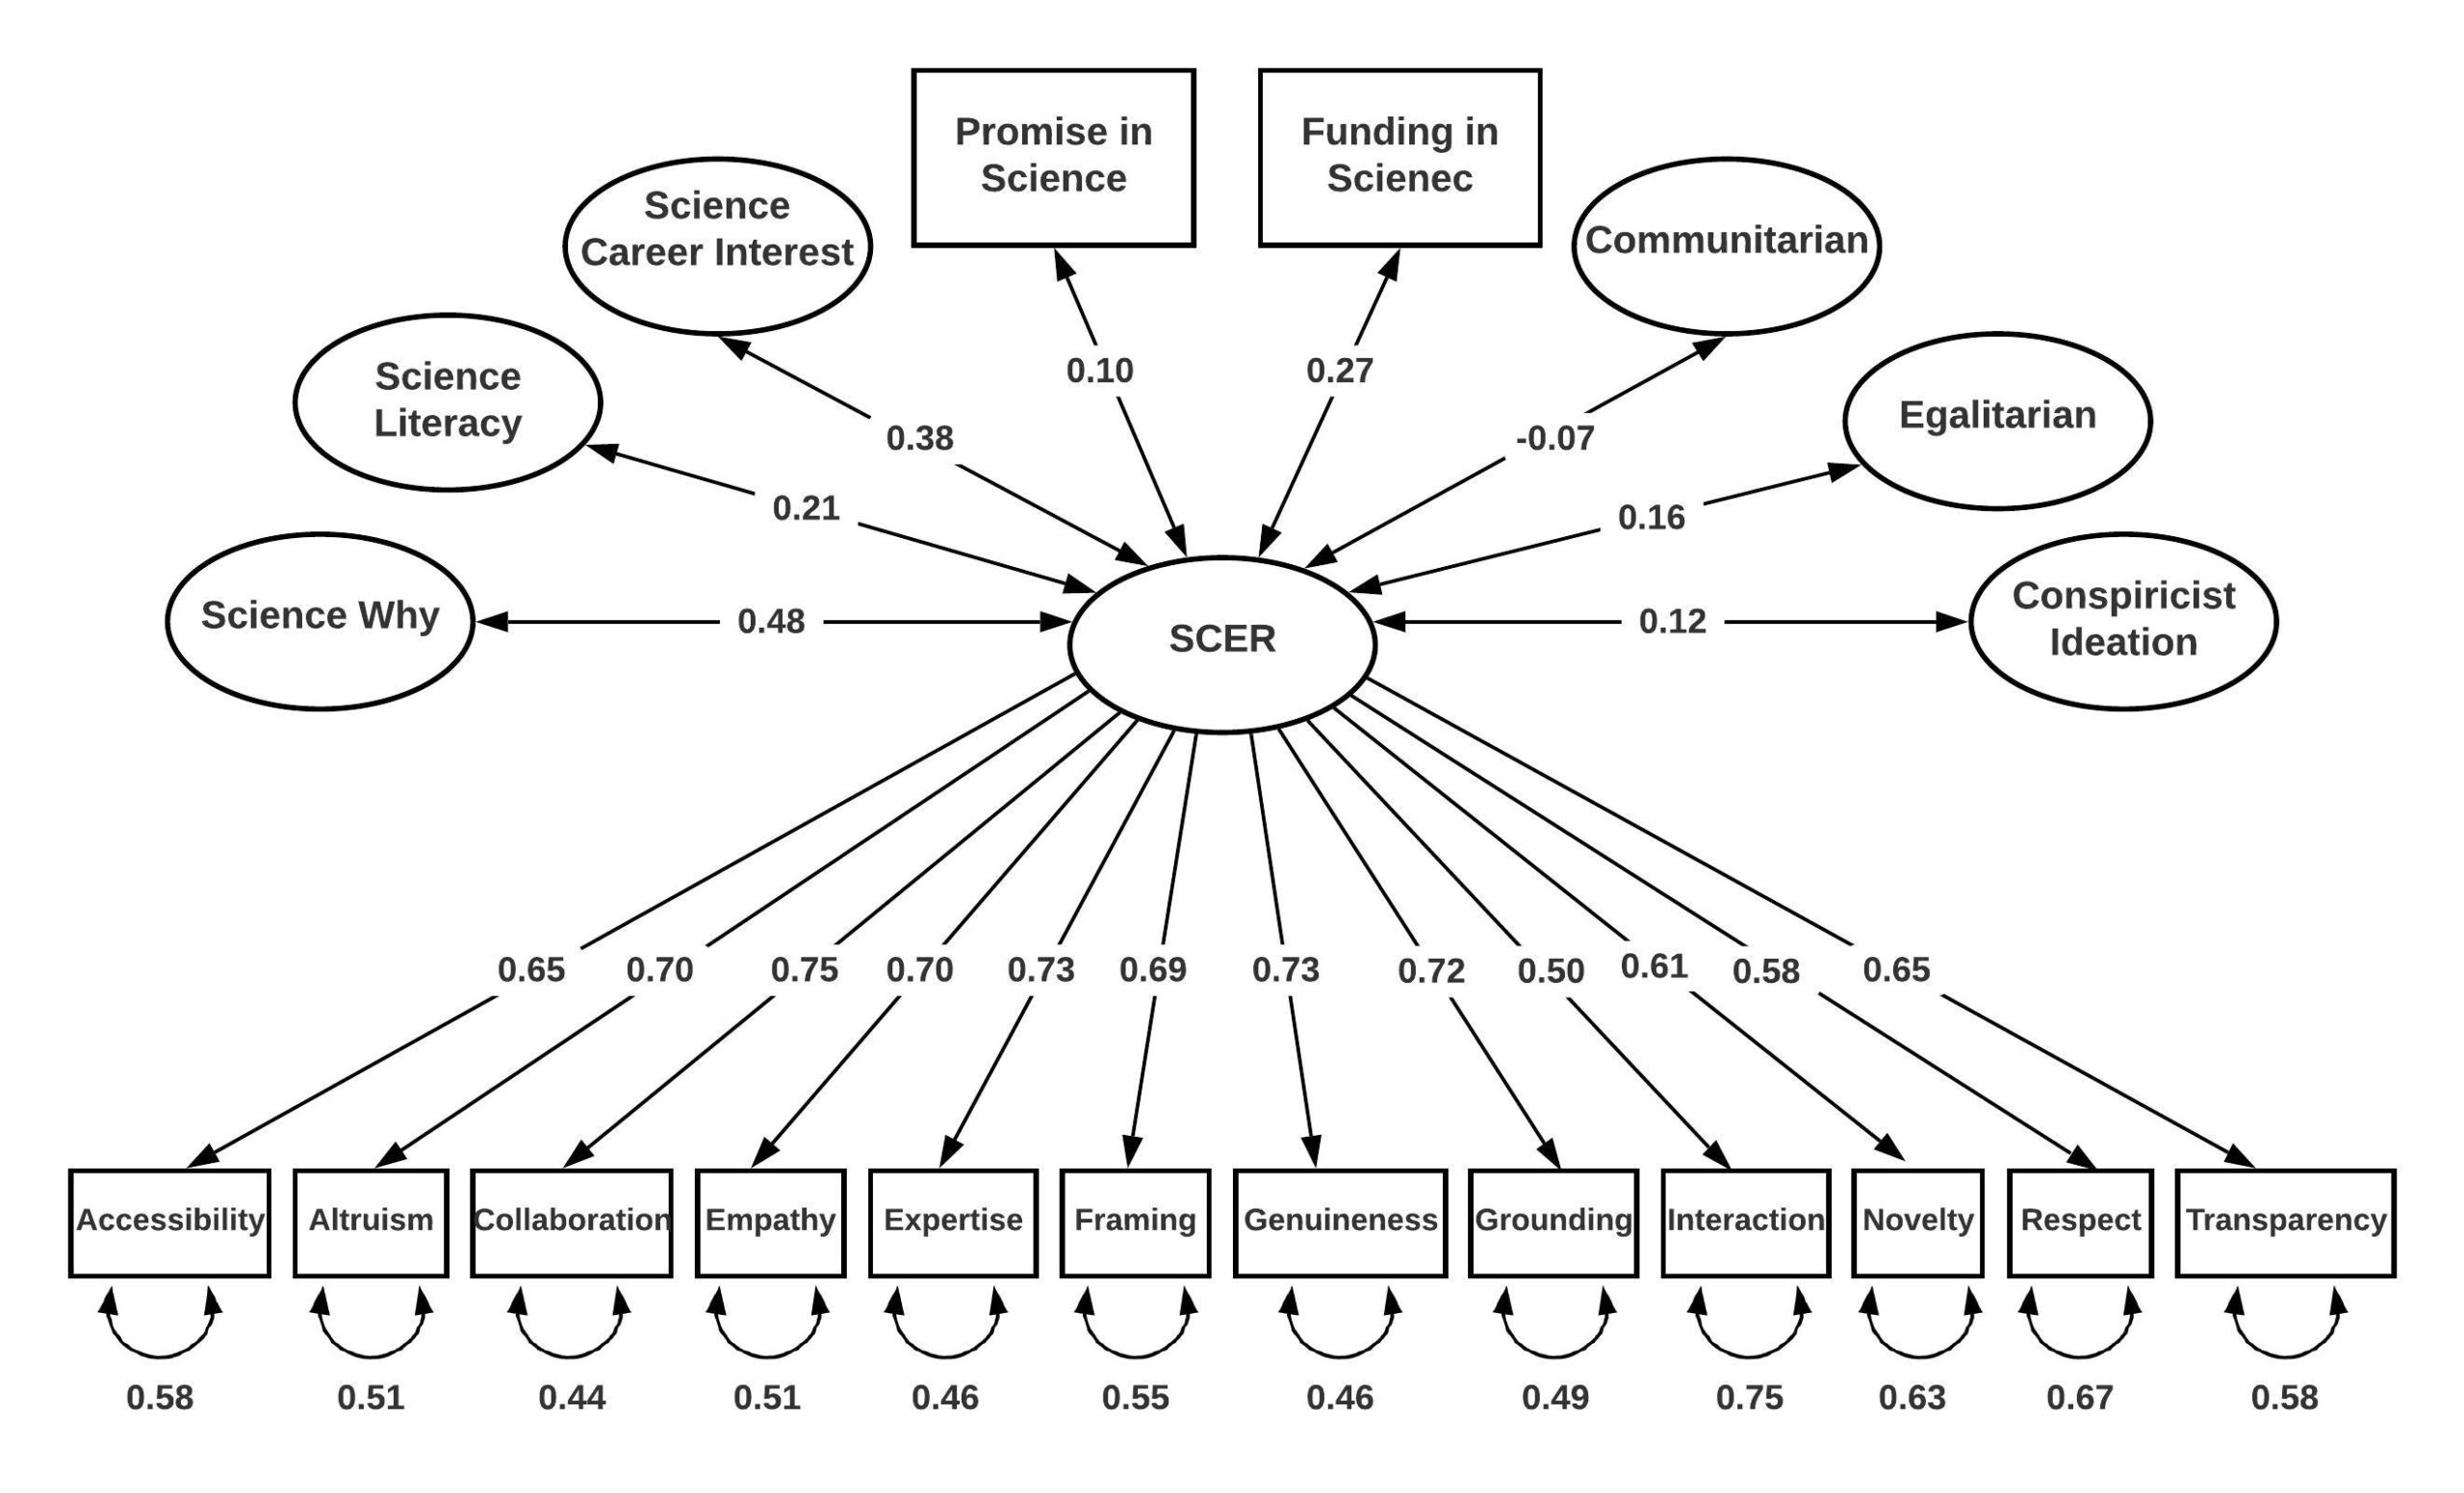
The next step was to compare my measurements to other scales of similar or competing ideas. I selected a handful of existing scales to externally validate my latent variable (science communication engagement):
- Science Why
- Science Literacy
- Science Career Interest
- Promise in Science
- Funding in Science
- Communitarian vs Egalitarian
- Conspiracist Ideation
These existing scales were also included in the survey, and depending on the consistency or inconsistency of the responses, I was on the right track. For example, if conspiracist ideation was positively correlated with my latent variable, I missed the mark. If science literacy and my latent variable were negatively correlated, I probably needed to go back to the drawing board. Luckily, my efforts researching the concpet and others like it paid off. My latent variable mapped to existing variables in the right direction. The factor loadings of each feature in science communication engagement (bottom of the figure) and comparisons to existing scales for validating the final measurement (top of the figure) were enough to move forward (and graduate as Dr. Copple).
Conclusion
I never got too far into the next steps due to a pivot away from higher education. There’s only a little use for continuing a research program without the potential of a tenured appointment at a university. There are plenty of practical applications for the skills and knowledge I gained through this process. I spent way more time with statistics than I ever imagined and enjoyed the process for the most part. The writing came easy after thorough consideration of existing research (and after the first 100 words each day). My PhD program taught me more than I could’ve imagined. But, I taught myself through most of the process described here, and the lessons I learned along the way will always be a part of who I am.